Here's How to Use Frappe to Create a Custom Chart

We love showing you useful open-source animations / charts / etc. A minimalist, but complete one is Frappe Charts.
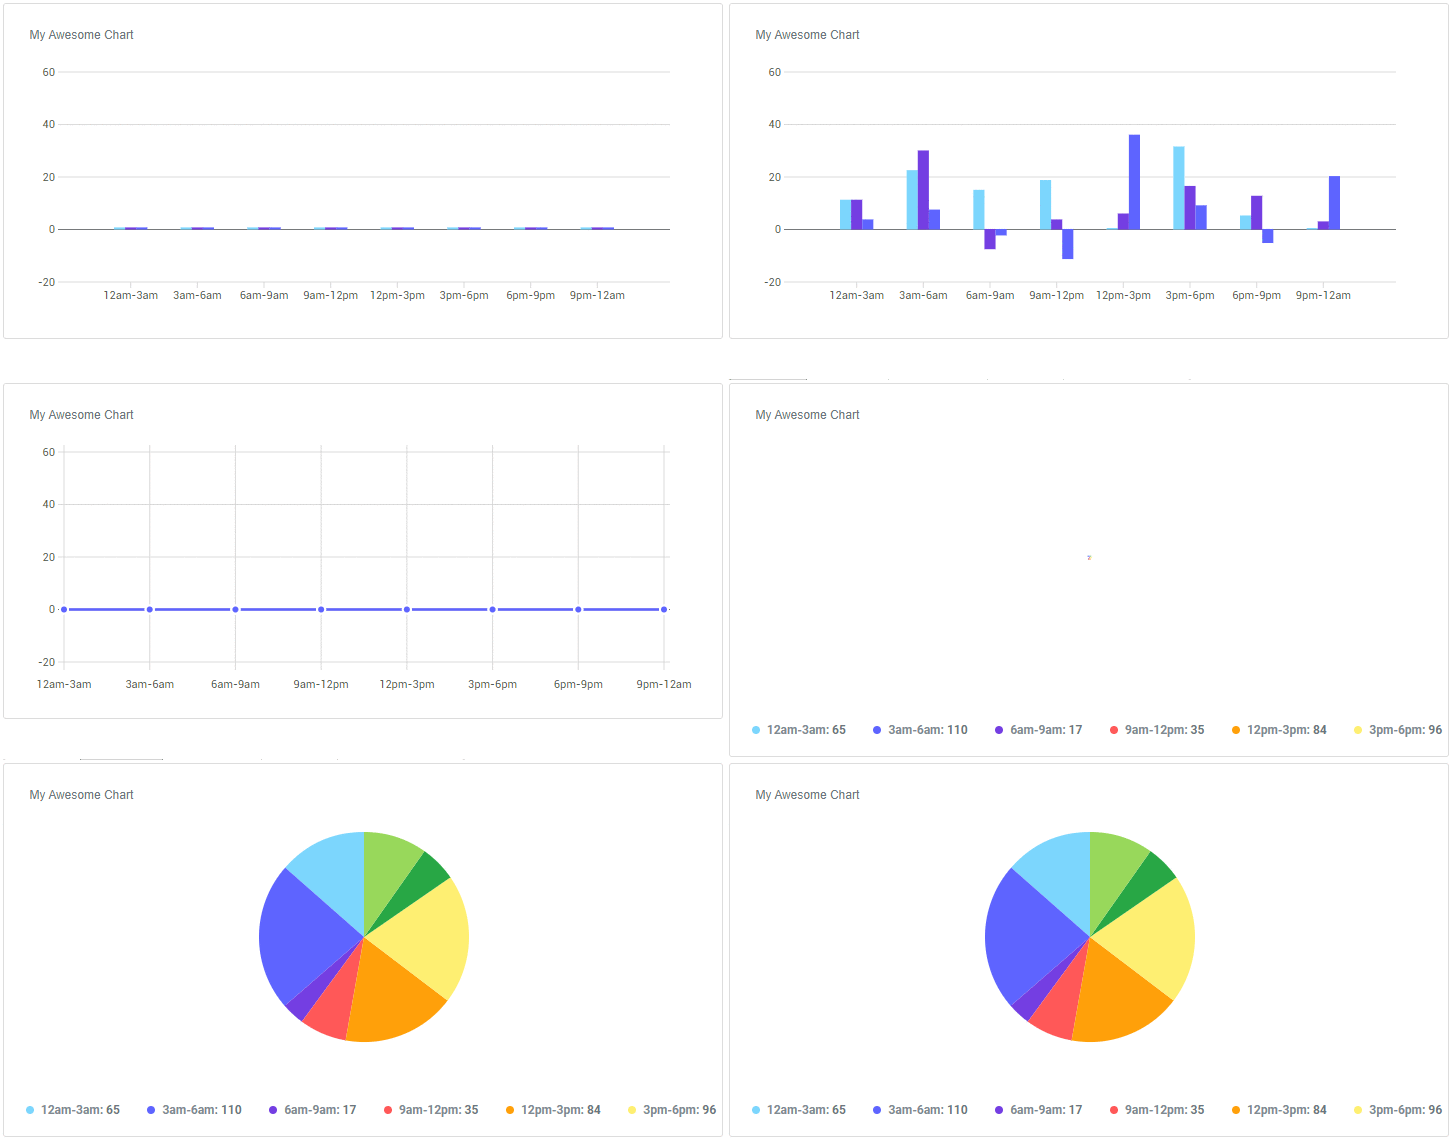
Frappe Charts is a simple, easy-to-use JavaScript library for creating responsive SVG charts in web applications without any dependencies. Hosted on GitHub, Frappe Charts lets you make the following types of charts:
- Bar
- Line
- Scatter
- Percentage
Installation of Frappe Charts
To install Frappe, there are a few options.
Run the following command:
npm install frappe-charts
And include it in your project
import Chart from "frappe-charts/dist/frappe-charts.min.esm"
Alternatively, you can download the full source code and upload the minimized version to your website. Then, add the following command near the top of your html file (see the link above).
After adding the code, there are some fairly simplistic variables that you can change to make the charts and graphs relevant to your project!
